


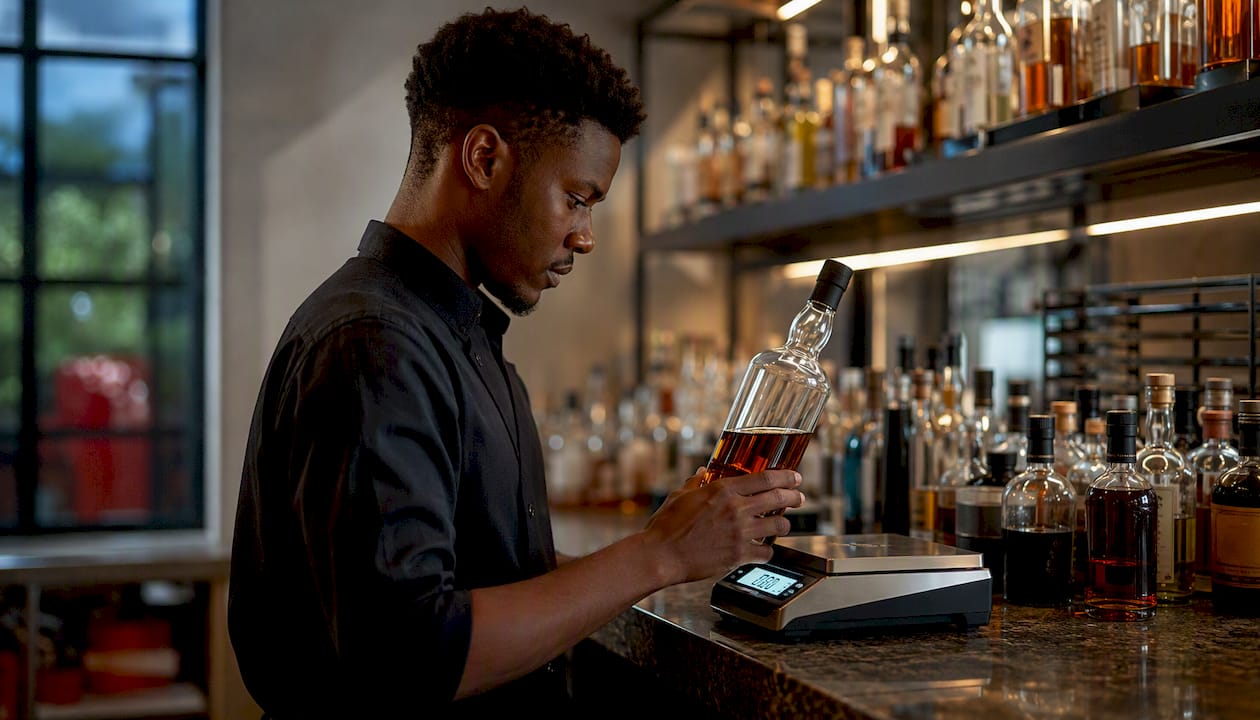
Start this week: take a baseline count of every bottle, keg, and mixer in your bar, log opening and closing quantities each shift, and compare what you used against what you sold. That single routine, done consistently, is where most bars recover their lost margin.
Here is what to do in the next seven days:
- Count every SKU and record opening quantities by area (back bar, speed rail, cellar, fridges).
- Log purchases as they arrive, checking delivery notes against invoices before anything goes on the shelf.
- Record closing quantities at the end of each shift or trading day.
- Calculate usage: opening stock + purchases received minus closing stock = usage.
- Compare usage cost to sales revenue to get your pour cost percentage, and flag the top three variances for investigation.
Run a full count weekly, a quick spot-check on your highest-risk spirits daily, and a deep audit monthly or before any large event. A structured weekly control loop — count, compare to expected usage, flag top variances, assign one corrective action — is the operational routine that turns counts into profit protection.
Pro Tip: Take your baseline count before your next delivery. Clean numbers from a known starting point are worth far more than a count taken mid-week with unlogged stock sitting in the cellar.
Key takeaways
Effective bar inventory management comes down to one discipline applied consistently: count accurately, compare to expected usage, and act on the top variance every single week.
| Point | Details |
|---|---|
| Take a baseline count now | Count every SKU this week to establish opening quantities before your next delivery. |
| Run a weekly control loop | Count, calculate usage, compare to sales, and assign one corrective action per major variance. |
| Set par levels from real data | Use actual weekly usage plus a 20–25% buffer to set par; review quarterly and before peak seasons. |
| Address your top variance first | Sort variances by value and investigate the largest one before moving to smaller discrepancies. |
| Train staff on one method | Consistent units, consistent order, and a fixed schedule reduce count error more than any software. |
| Nairobibarschool for practical training | Nairobibarschool’s hands-on courses embed inventory discipline, portion control, and recipe costing alongside professional bartending skills. |
Table of Contents
- Why does bar inventory management matter for your profit?
- How to run a bar inventory count from start to finish
- How often should you take bar inventory?
- Managing spirits, kegs, mixers, and perishables
- How do you set par levels and manage reordering?
- Portion and pour control: how to stop losing margin one measure at a time
- Tracking waste, spotting variance, and preventing theft
- Which software and POS systems work best for UK bars?
- Key metrics and formulas every bar manager must track
- How do you choose the right inventory process or system?
- Staff training and standard operating procedures for inventory accuracy
- Environmental and sustainability considerations in bar inventory
- What actually matters in bar inventory: a trainer’s perspective
- Build the skills that make inventory discipline stick
- Sources
Why does bar inventory management matter for your profit?
Every bottle that leaves your bar without a corresponding sale is money gone. Shrinkage in a busy UK venue comes from several directions at once: over-pouring by even a quarter of an ounce per drink, spillage that goes unlogged, staff comps that bypass the till, theft, receiving errors where a case short-delivered is never queried, and slow-moving stock that expires on the shelf. None of these feel catastrophic individually. Together, they erode margin fast.
Connecting inventory counts, sales data, and recipes lets you calculate expected usage and surface variance that points directly to over-pouring, theft, or receiving errors. Without that connection, you are guessing at where the loss is coming from.
Pour cost percentage is the number to watch. A well-run bar typically targets a pour cost of 18–24% for spirits and 20–30% for draught beer, though the right target depends on your pricing and product mix. A bar running at 30% pour cost on spirits when it should be at 22% is losing roughly £8 in every £100 of spirit sales to uncontrolled shrinkage. On a venue turning over £15,000 a week in drinks, that gap is material.
The types of loss to track:
- Over-pouring: a bartender free-pouring generously adds up across hundreds of drinks a night.
- Spillage and waste: unlogged spillage is invisible in your counts and inflates apparent usage.
- Comps and voids: drinks given away or voided without a manager authorisation code distort your sales-to-usage ratio.
- Theft: both customer and staff theft; systematic patterns show up in variance reports before they show up anywhere else.
- Invoice and receiving errors: poor receiving and late invoice entry create false variance that looks like theft or over-pouring when it is actually a paperwork gap.
- Dead stock: slow-moving bottles tie up cash and eventually expire.
A bar that fixes its top variance item — say, a premium gin showing 15% more usage than sales justify — often recovers that margin within a fortnight of correcting the root cause.
How to run a bar inventory count from start to finish
A best-practice counting methodology follows a clear sequence: prepare and label stock areas, perform opening and closing counts, record purchases, compute usage, reconcile variance, and act on the top variances.
Pre-count checklist
Before counting begins, assign two staff members (never just one, and never the same person who reconciles the results), clear all areas of mid-shift clutter, and confirm that all deliveries received since the last count have been logged. Have your count sheets or app ready, organised by area: back bar, speed rail, cellar, beer fridges, wine storage, and mixers/perishables separately.
The counting method
- Count full bottles first, by product, in the same order every time. Consistency matters more than speed.
- For partial bottles, use a visible marking system: mark the bottle at 25%, 50%, and 75% full and convert remaining volume to standard units using ounce or millilitre conversions. A 70cl bottle at 50% = 350ml remaining. Record this consistently across counters.
- For kegs, use a yield chart: total keg volume in litres divided by your average drink size gives theoretical yield. Weigh the keg if you have scales, or use a keg monitor. Reconcile draught variance separately from bottled stock.
- Count beer cans and bottles by case and individual unit.
- Count wine by bottle, noting any opened bottles behind the bar.
- Count mixers, garnishes, and perishables last, noting expiry dates as you go.
Core formulas
| Metric | Formula |
|---|---|
| Usage | Opening stock + purchases received minus closing stock |
| Pour cost % | (Usage cost ÷ sales revenue) × 100 |
| Variance | Expected usage minus actual usage |
| Inventory value | Units on hand × unit cost |
Worked example: You open the week with £1,200 of spirits on hand. You receive £400 of deliveries. Your closing count shows £1,050 remaining. Usage = £1,200 + £400 minus £1,050 = £550. Your spirit sales for the week were £2,800. Pour cost = (£550 ÷ £2,800) × 100 = 19.6%. If your target is 20%, you are on track. If it comes in at 26%, you have a £168 variance worth investigating.
A downloadable inventory template with these fields pre-built saves significant setup time. Most bar inventory software providers offer one; the workflow above maps directly onto any spreadsheet or app format.
Pro Tip: Number your count sheets and file them. A paper trail of weekly counts is your first line of defence if a variance investigation escalates.
How often should you take bar inventory?
The right cadence depends on your volume, your risk profile, and how much staff time you can allocate without disrupting service.
| Cadence | Task | Time estimate | Best for |
|---|---|---|---|
| Daily | Quick spot-check on high-risk spirits and cash-bar items | 15–20 minutes | High-volume venues, festival bars |
| Weekly | Full count of all stock areas | 1–3 hours depending on size | Most UK bars and pubs |
| Monthly | Deep audit: reconcile supplier invoices, check dead stock, review par levels | 3–5 hours | All venues |
| Event-driven | Pre- and post-event count for private hires and large bookings | Variable | Any venue with private events |
For most UK bars, a weekly full count is the baseline. Daily checks on your top five highest-value spirits take under 20 minutes and catch problems before they compound across a full week.
Cycle counting is worth considering for larger venues where a full weekly count is too labour-intensive. Count your highest-risk, highest-value categories every week, and rotate through lower-risk SKUs on a fortnightly or monthly schedule. This keeps close watch on the products that drive margin without requiring every area to be counted every time.
Staffing tips:
- Schedule counts before opening or after last orders, never mid-service.
- Use two-person teams: one counts, one records. Swap roles weekly.
- Keep the same staff on the same areas each week so they learn the layout and spot anomalies faster.
Managing spirits, kegs, mixers, and perishables
Different product types need different controls. Treating a keg the same way you treat a bottle of gin produces inaccurate counts and missed variance.
Spirits are your highest-value, highest-risk category. Store them in a locked area, count them first, and use the partial-bottle marking system described above. Organise shelves in the same order as your count sheet so counting is a straight walk, not a search.

Kegs and draught beer require yield-based counting. High-volume venues reduce counting labour by scanning kegs via yield charts (litres per keg divided by average drink size) and reconciling draught variance separately from bottled stock. A full keg of lager at 50 litres, served in 568ml pints, yields approximately 88 pints. If your POS shows 80 pints sold from a keg that started full, 8 pints are unaccounted for and worth investigating.
Beer cans and bottles are straightforward to count by unit and case. Rotate stock using first-in, first-out (FIFO) to reduce expiry waste.
Wine needs temperature-controlled storage and careful rotation. Log opened bottles separately from sealed stock. A half-consumed bottle left overnight without a record is a common source of unlogged waste.
Mixers and perishables should be counted last and logged with expiry dates. A bar sanitation checklist that includes checking mixer expiry dates and refrigerator temperatures at each shift change reduces spoilage and keeps your beverage stock control accurate.
Pro Tip: Invest in a set of digital scales for partial-bottle measurement. Weighing a bottle and subtracting the tare weight gives you volume remaining to within a few millilitres, far more accurately than eyeballing the level.
How do you set par levels and manage reordering?
A par level is the minimum quantity of a product you need on hand to get through your busiest period before the next delivery. Setting it correctly means you never run out during service and never over-order to the point of tying up cash in slow-moving stock.
Par level calculation: take your average weekly usage for a product, add a safety buffer (typically 20–25% to cover demand spikes), and set that as your par. If you use 10 bottles of house vodka per week and your delivery lead time is two days, your par should cover at least 1.5 weeks of usage: roughly 15 bottles.
Reorder point: the quantity at which you place an order. Reorder point = (average daily usage × lead time in days) + safety stock.
| Product type | Par level | On-hand | Reorder trigger |
|---|---|---|---|
| House spirits (per SKU) | 15 bottles | 8 bottles | Below 10 bottles |
| Premium spirits (per SKU) | 6 bottles | 3 bottles | Below 4 bottles |
| House wine (per case) | 4 cases | 2 cases | Below 3 cases |
| Draught lager (per keg) | 3 kegs | 1 keg | Below 2 kegs |
Many inventory solutions include automated ordering, min/max reorder levels, and price-tracking to help consolidate purchasing and flag supplier price increases before they hit your cost of goods.
Vendor checklist for reliable ordering:
- Confirm lead times in writing and review them seasonally (Christmas, bank holidays).
- Ask about minimum order quantities and whether partial-case ordering is available.
- Agree a process for short deliveries: who contacts the rep, how credits are raised, and how the inventory record is corrected.
- Review supplier pricing quarterly and compare against at least one alternative.
Align your reorder schedule with your delivery days. If your supplier delivers on Tuesdays and Fridays, place orders on Monday and Thursday so stock arrives before the weekend peak.
Portion and pour control: how to stop losing margin one measure at a time
A quarter-ounce over-pour on a 25ml measure of spirits sounds trivial. Across 200 spirit serves on a Saturday night, that is 50 extra measures given away for free — roughly £75 in lost revenue at a £1.50 per-measure cost, before you account for the margin on top.
Comparing your control options
| Method | Pros | Cons | Best for |
|---|---|---|---|
| Jiggers | Accurate, low cost, builds discipline | Slows service if staff are untrained | All venues; essential for training |
| Measured pour spouts | Consistent, fast | Can be bypassed; needs regular calibration | Busy bars with high spirit volume |
| Free-pour with training | Fastest service | Highest variance risk; requires regular testing | Experienced staff only, with weekly checks |
| Automated dispensers | Most accurate; full audit trail | High capital cost; limits menu flexibility | High-volume, high-margin venues |
Worked example: a bar serving 300 spirit drinks per night at a 25ml standard measure, with bartenders free-pouring at an average of 30ml, is over-pouring by 5ml per drink. At a spirit cost of £0.80 per 25ml, that is an extra £0.16 per drink, or £48 per night, or roughly £17,500 per year.
Staff training drill: give each bartender a jigger, a water bottle, and an empty glass. Ask them to free-pour what they believe is 25ml, then measure it with the jigger. Most will pour 28–35ml. Repeat weekly until the average lands within 2ml of the target. This drill takes ten minutes and builds the muscle memory that reduces variance.
Pro Tip: Run a blind pour test monthly: ask staff to free-pour into a measuring jug without watching the scale, then reveal the result. Public accuracy scores, posted on the staff noticeboard, create healthy accountability without blame.
Tracking waste, spotting variance, and preventing theft
Variance is the gap between what your inventory says you used and what your sales say you should have used. Every bar has some variance. The question is whether it is within an acceptable threshold or pointing to a systemic problem.
Waste log fields to track
Every waste event should be logged with: date, product, quantity, reason (spillage, spoilage, comp, transfer, breakage, or theft), and the staff member on shift. Without a reason code, a waste log is just a list of losses with no path to fixing them.
Variance investigation checklist
- Pull the variance report for the period and sort by value, largest first.
- Check whether the top variance item had any unlogged deliveries or transfers during the period.
- Review the waste log for that product: is the variance explained by logged waste?
- Check the POS for voids, comps, and refunds on that product.
- If variance is unexplained after steps 2–4, schedule a blind count of that product for the next shift.
- Assign one corrective action per major variance: a recount, a training session, or a process change.
Red flags that suggest theft or systematic over-pouring
- A specific product consistently shows higher variance than others of similar volume.
- Variance spikes on shifts worked by the same individual or team.
- POS voids and comps are clustered around the same time of night or the same till.
- Waste logs are consistently blank on high-variance days.
- Deliveries are frequently signed off by the same person without a second check.
Pro Tip: Run a blind count: count a high-risk product without telling the team it is being counted, then compare to the running total. The person who reconciles the count should never be the same person who manages that product’s storage area.
Which software and POS systems work best for UK bars?
Bar inventory software can reduce the time spent on manual counts by up to 85% and replace paper processes with scanning and audit trails. For a UK bar manager spending three hours a week on manual counts, that is a meaningful return on a modest monthly subscription.
Inventory management software commonly offers barcode scanning, recipe linking, purchase and invoice import, and variance reporting to enable perpetual inventory — a running count that updates in near real-time rather than a snapshot taken once a week.
POS systems that integrate with inventory let you compare expected versus actual usage and identify issues such as bartender over-pouring or recipe mismatches almost immediately after a shift closes.
Different POS systems suit different venue sizes and complexity; evaluate each on best-for size, pricing structure, inventory features, integrations, and mobile scanning capability.
| System | Best for | Pricing shape | Inventory tracking | Integrations | Mobile scanning | Reporting and alerts |
|---|---|---|---|---|---|---|
| Square | Small to medium bars, low complexity | Free tier available; paid plans from £— | Basic stock tracking; no recipe linking on free plan | Accounting, delivery apps | Yes, via app | Basic sales reports; limited variance alerts |
| Lightspeed | Medium to large, multi-location | From £—; modular add-ons | Recipe linking, purchase orders, variance reports | Accounting, loyalty, suppliers | Yes | Advanced reporting; customisable alerts |
| EPOS Now | UK-focused; small to medium venues | Hardware + software bundles; software from £25/month | Stock management; integrates with specialist inventory apps | Wide UK app marketplace | Yes | Sales and stock reports; alert thresholds |
| Zettle by PayPal | Small, mobile, or pop-up bars | Free app; card reader cost only | Basic product tracking; no dedicated inventory module | PayPal, some accounting apps | Yes | Basic sales data; no variance reporting |
Questions to ask vendors before signing:
- Does your system integrate directly with my existing POS, or does it require a manual export?
- How is onboarding structured, and is training included in the price?
- Can the system handle multiple locations or storage areas?
- Does the audit trail show who made each adjustment and when?
- What is the contract length, and what are the exit terms?
Must-have features for any venue: POS integration, recipe linking, mobile scanning, purchase import, and variance reporting. Nice-to-have for high-volume venues: automated reorder alerts, supplier price-tracking, and multi-location dashboards.
Key metrics and formulas every bar manager must track
| Metric | Formula | Target / alert threshold |
|---|---|---|
| Pour cost % | (Usage cost ÷ sales) × 100 | Spirits: 18–24%; beer: 20–30% |
| Inventory value | Units on hand × unit cost | Track weekly; flag if rising without sales growth |
| Actual usage | Opening + purchases minus closing | Compare to expected usage each period |
| Expected usage | Units sold × recipe cost per unit | Derived from POS sales data and recipe links |
| Variance (£) | (Expected usage minus actual usage) × unit cost | Investigate any variance above £50 per SKU per week |
| Inventory turns | Cost of goods sold ÷ average inventory value | 4–8 turns per month for most bars |
| Dead stock ratio | Units unsold for 30+ days ÷ total SKUs | Flag anything above 10% of your range |
Worked example for pour cost %: your spirits usage cost for the week is £620. Your spirit sales revenue is £2,900. Pour cost = (£620 ÷ £2,900) × 100 = 21.4%. That sits within a healthy range. If the same calculation next week produces 27%, the £160 difference is your investigation starting point.
Connecting counts, sales, and recipes makes expected usage calculable, which is what turns a variance number from a mystery into a diagnosis.
How do you choose the right inventory process or system?
Readiness checklist
Before investing in software, check whether your operation is ready to use it:
- Do you have consistent storage layouts that make counting repeatable?
- Is your POS recording every sale accurately, including modifiers and voids?
- Do you have staff capacity to run counts on a fixed schedule?
- Are your supplier relationships stable enough to give you reliable lead times?
- Do you have a budget for both the software subscription and the onboarding time?
If you answer no to more than two of these, start with a well-structured spreadsheet and a fixed weekly count routine. Software amplifies good processes; it does not fix broken ones.
When to stay manual, when to invest in software
- Spreadsheet first if you have fewer than 50 active SKUs, one location, and a small team. A weekly count sheet with the formulas from this guide will cover you.
- Invest in software when you are managing 100+ SKUs, running multiple locations, or when your weekly count is taking more than three hours and still producing unexplained variance.
Vendor red flags
- No direct POS integration (requires manual CSV exports).
- Onboarding takes longer than four weeks for a single-site venue.
- Pricing is opaque or changes significantly after the trial period.
- No audit trail showing who made each inventory adjustment.
- The vendor cannot name a UK reference customer in a similar venue type.
Staff training and standard operating procedures for inventory accuracy
Training staff on a single counting method, consistent units, and a fixed schedule improves accuracy and reduces long-term variance. The biggest source of count error in most bars is not dishonesty — it is inconsistency: different staff counting the same bottle differently, or recording in different units.
Training outline
Induction (first week): cover the counting method, the partial-bottle system, waste log fields, and the reason codes. Have new staff shadow an experienced counter for two full counts before counting independently.
Weekly refresh (ongoing): a five-minute briefing before each count shift. Review last week’s top variance item and what was done about it. Reinforce the rule: same order, same units, same time.
Monthly spot check: a manager or senior staff member counts a selection of high-risk SKUs without advance notice and compares to the running total. Discrepancies feed into the next training session.
Seasonal training: before Christmas, summer festivals, or any large event period, run a session on event-specific inventory controls: pre-event counts, mid-event spot checks, and post-event reconciliation.
Competency checklist
- Can the staff member count a partial bottle and convert it to millilitres accurately?
- Can they log a waste event with the correct reason code?
- Do they know the par levels for the top ten SKUs in their area?
- Can they calculate usage from opening stock, purchases, and closing stock?
Roleplay and blind-count drills build the muscle memory that makes accurate counting automatic. Set up a mock stock area, give the trainee a count sheet, and time them. Then reveal the “correct” count and discuss any discrepancies. Nairobibarschool’s practical training courses use exactly this kind of hands-on drill to embed inventory discipline alongside bartending and mixology skills.
Pro Tip: Post a laminated one-page SOP at each counting station: product order, unit conventions, partial-bottle conversion table, and waste log reminder. Staff who can see the method while they count make fewer errors.
Environmental and sustainability considerations in bar inventory
Sustainability in bar stock management is not just an ethical position — it is a financial one. Every bottle of expired mixer thrown away, every keg returned half-full, and every garnish composted at the end of the night represents a cost that appeared in your purchasing but never appeared in your sales.
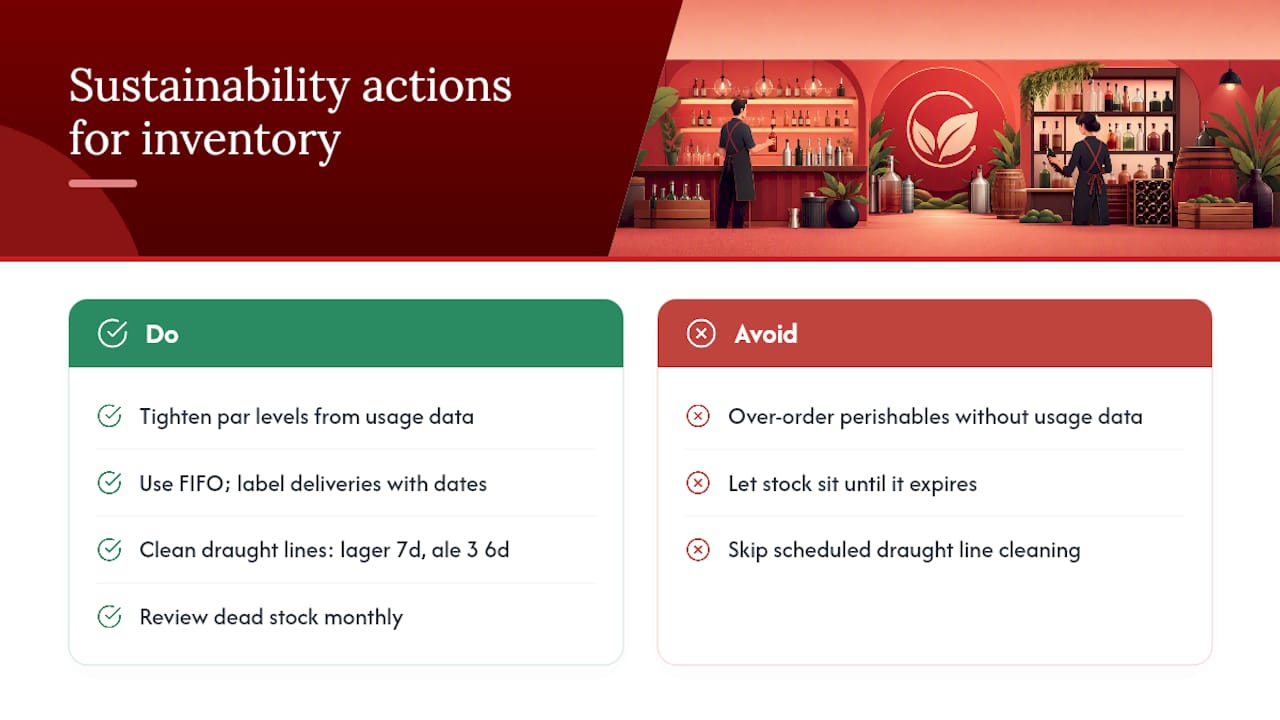
Reduce over-ordering by tightening par levels based on actual usage data rather than gut feel. A bar that over-orders perishables because it has no reliable usage history will consistently generate avoidable waste.
FIFO rotation (first in, first out) is the single most effective practice for reducing spoilage in both perishables and bottled stock with a shelf life. Label every delivery with its arrival date and train staff to pull from the front of the shelf.
Draught beer waste is a significant environmental and financial issue. Cleaning lines regularly, as part of a structured bar cleaning checklist, reduces the volume of beer wasted during line pulls. A bar sanitation checklist that schedules line cleaning every seven days for lager and every three to five days for cask ale keeps waste within acceptable limits and maintains product quality.
Supplier consolidation reduces delivery frequency, which cuts both transport emissions and the administrative burden of receiving. Fewer, larger orders also tend to attract better pricing.
Dead stock review should be a standing agenda item at your monthly audit. A bottle that has not moved in 30 days is a candidate for a cocktail feature, a staff training session, or a return to the supplier. Letting it sit until it expires is the worst outcome for both margin and waste.
Tracking waste by reason code, as described in the variance section, also gives you the data to report on sustainability performance — useful for venues pursuing accreditation or responding to customer expectations around responsible sourcing.
What actually matters in bar inventory: a trainer’s perspective
Most bar managers know they should be counting stock. The ones who actually protect their margins are the ones who treat the weekly count as a management meeting with the numbers, not a chore to delegate and forget.
The friction is real. A busy Friday close is not when anyone wants to count bottles. The fix is not motivation — it is structure. When the count sheet is pre-printed, the areas are labelled, and the two-person team is rostered in advance, the count happens because the system makes it easier to do it than to skip it.
The metric that changes behaviour fastest is not pour cost percentage in the abstract. It is the pound figure on the variance report with a name next to it: this product, this shift, this much unaccounted for. That specificity is what turns a weekly count from a compliance exercise into a conversation.
Software helps, but it is not the answer on its own. A bar that adopts inventory software without fixing its counting discipline will produce faster, more automated inaccurate data. The discipline comes first. The software then amplifies it.
.
.
Build the skills that make inventory discipline stick

Knowing the formulas is one thing. Applying them under pressure, on a busy shift, with a team that has varying levels of buy-in, is another. Nairobibarschool’s professional bartending and mixology certificate teaches portion control, recipe costing, and beverage stock control as practical skills, not theory — in a realistic bar environment, with trainers who have worked the industry.
Graduates leave with the hands-on competency to run accurate counts, set par levels, and train their own teams. If you are building a team that takes inventory seriously, starting with structured, accredited training is the most direct route. Visit Nairobibarschool to see the full range of courses and request enrolment information.
Sources
- Bar Inventory Management: The Complete 2026 Guide | BarGuard
- BevSpot Makes Food & Beverage Inventory Management Simple
- Bar Inventory Management: The Complete How-To Guide
- Inventory Management for Bars and Pubs | Thrive by Shopventory
- The Ultimate Bar Inventory Management Guide – Restaurant365